Our Knowledge Hub
Dive into our collection of expert articles, comprehensive guides, insightful case studies, and recommended tools to empower your research and data analysis journey.
Explore Our Resources
At Bright Experts Statistics Services, we believe in empowering our clients and the broader research community with valuable knowledge. Our resources section is designed to provide you with in-depth insights, practical tips, and expert perspectives on various aspects of statistics, data analysis, research methodology, and monitoring & evaluation.
Latest Academic Articles
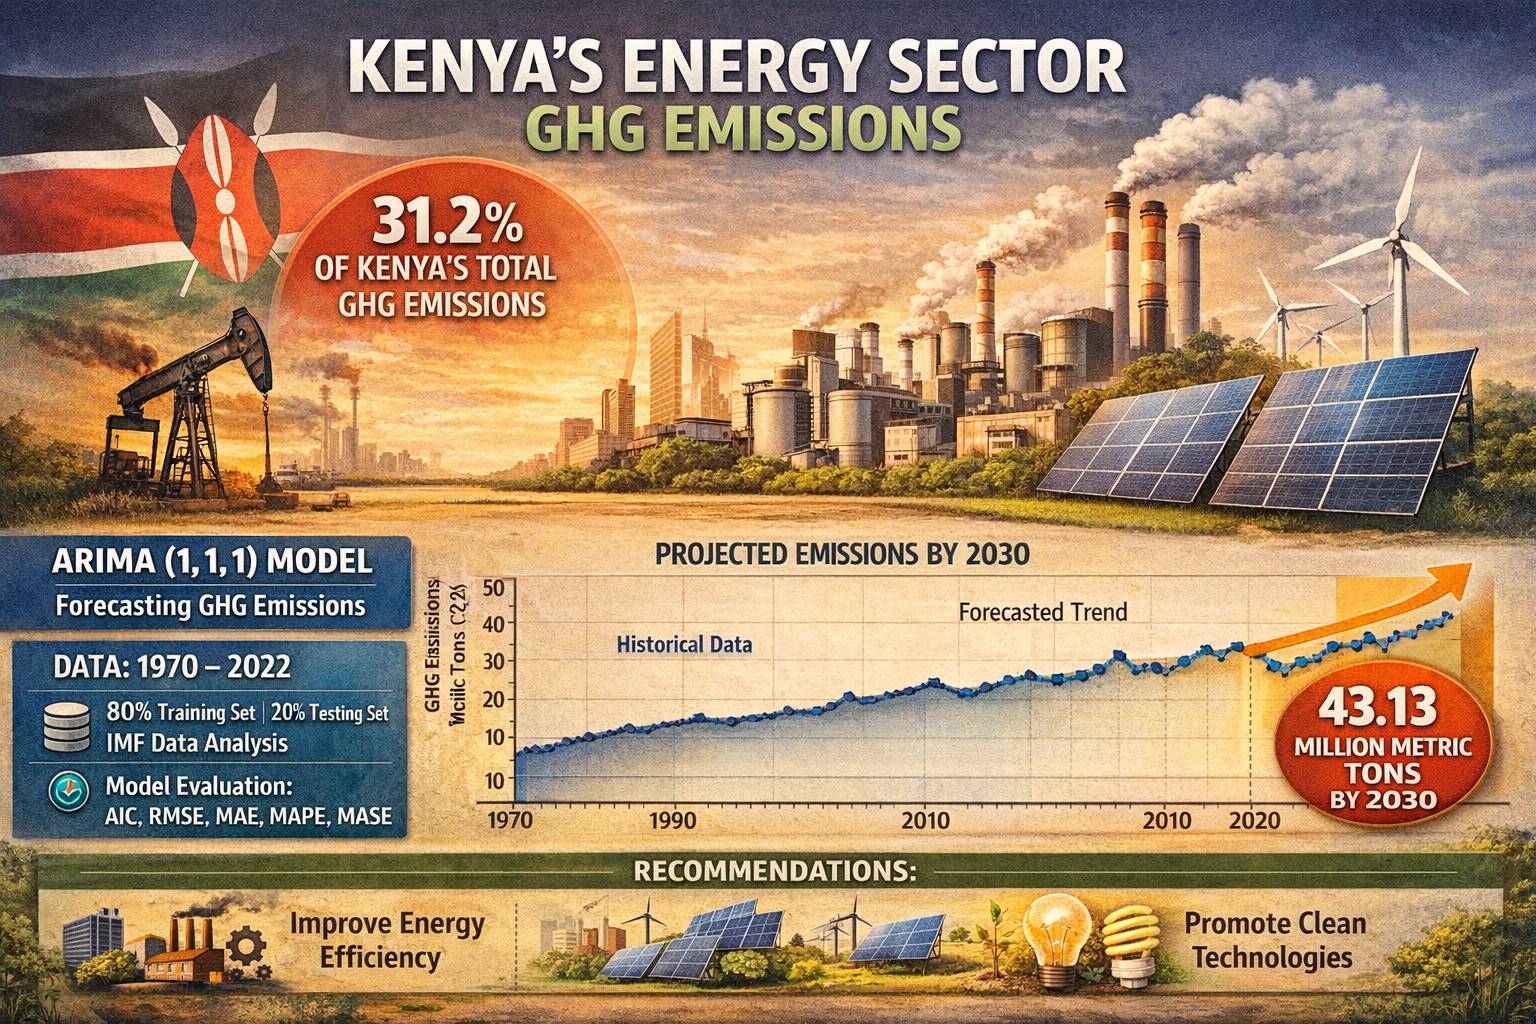
Modelling and Forecasting of Greenhouse Gas Emissions by the Energy Sector in Kenya Using Autoregressive Integrated Moving Average (ARIMA) Models
Understanding and addressing climate change begins with how well we can measure and predict its key drivers. In Kenya, the energy sector remains one of the largest contributors to greenhouse gas emissions... [Content same as original]
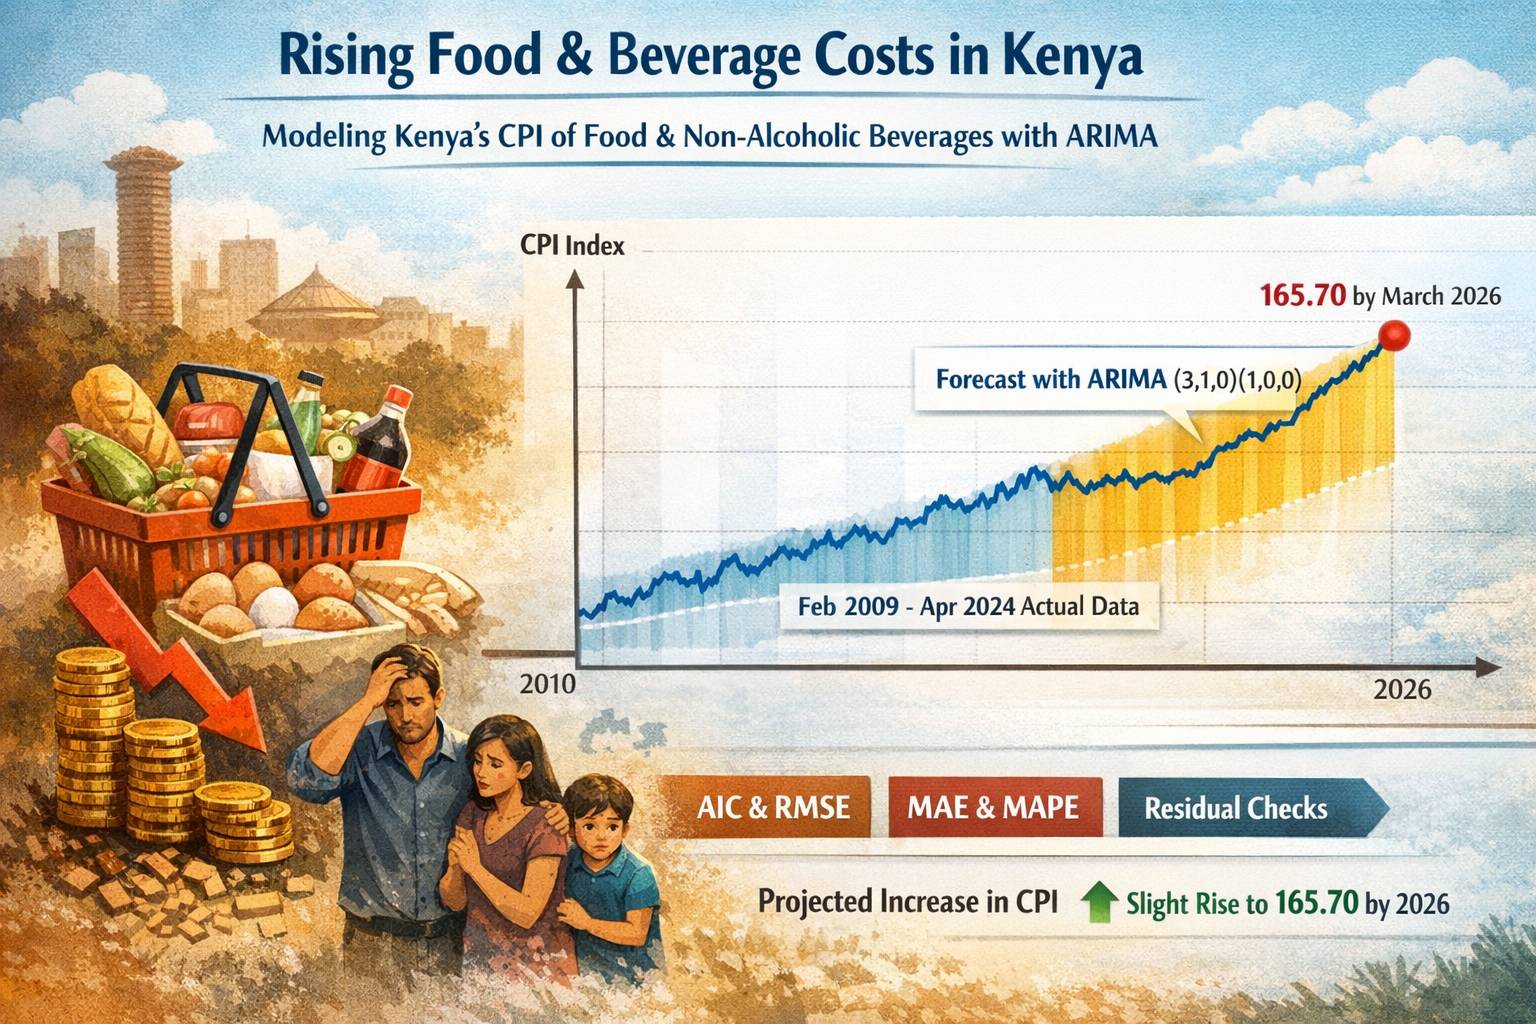
Modeling and Forecasting of Consumer Price Index of Foods and Non-Alcoholic Beverages in Kenya Using Autoregressive Integrated Moving Average Models
Tracking the cost of living is essential for understanding economic wellbeing, especially in a rapidly evolving economy like Kenya's. Among the most critical indicators is the Consumer Price Index (CPI)... [Content same as original]
Modelling GHG Emissions by Kenya's Agricultural Sector: Comparative Analysis
This narrated research poster was presented by our lead statistician, Michael Chege, at the Greenhouse Gas and Animal Agriculture 2025... [Content same as original]
Cancer Burden and Services Accessibility across Europe: Comparative Analysis
This pre-recoded flash talk presented at the Data Driven Cancer Research Conference 2026, explored cross-national differences... [Content same as original]
Guides & Tutorials
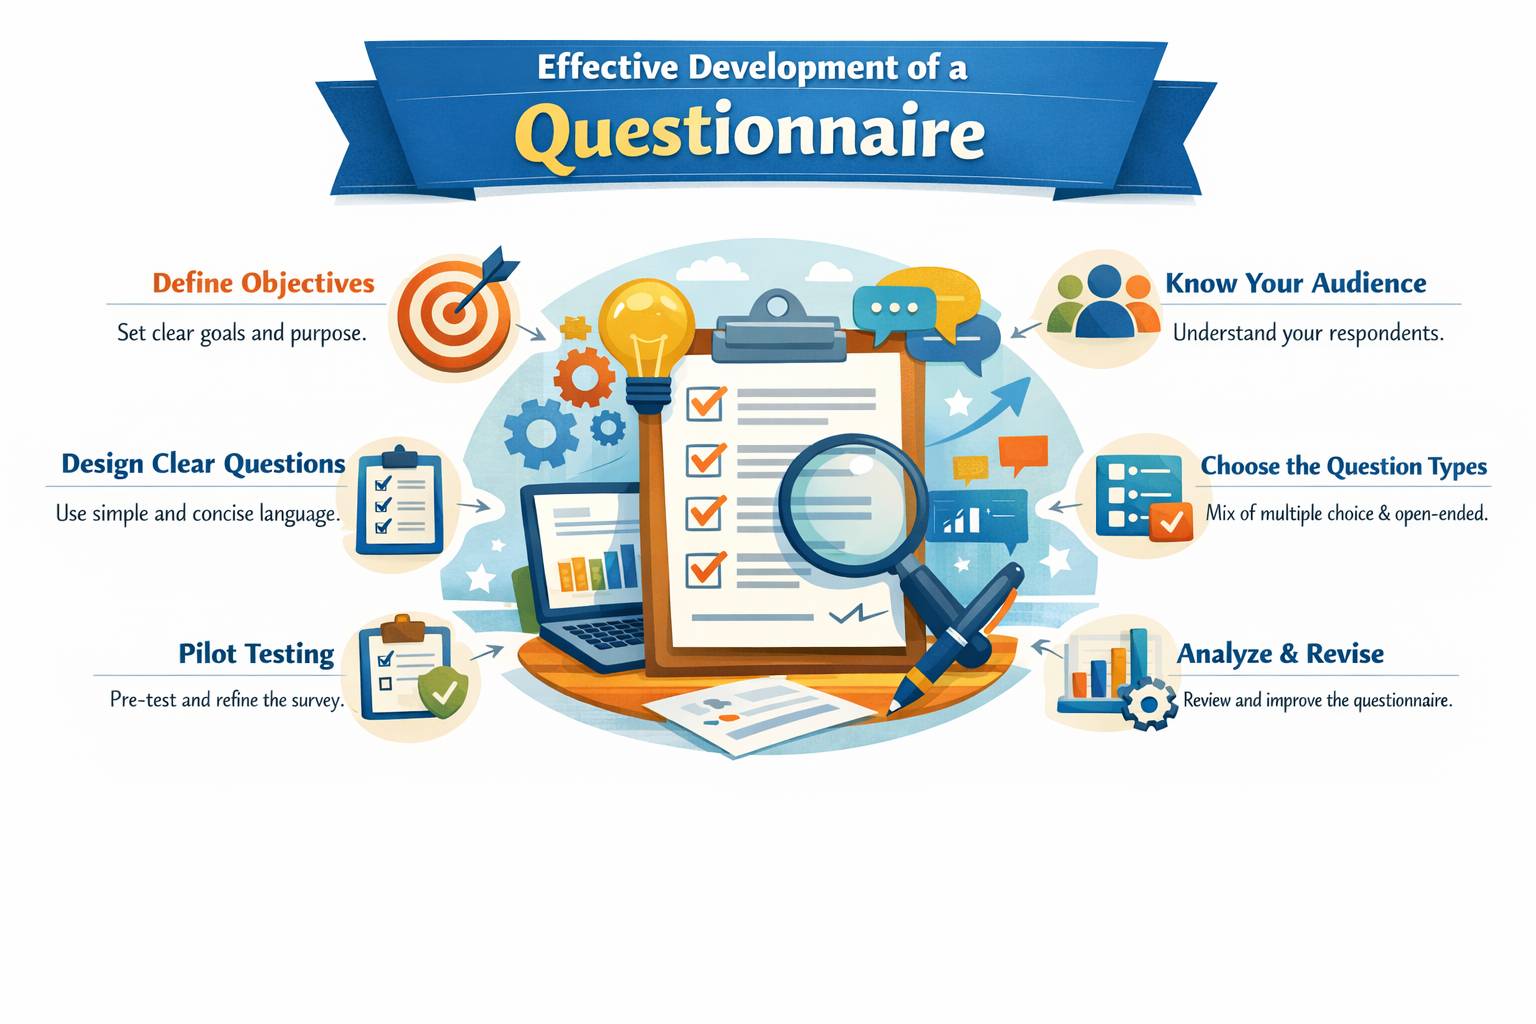
A Step-by-Step Guide to Questionnaire Design
Learn the best practices for crafting effective and unbiased survey instruments.
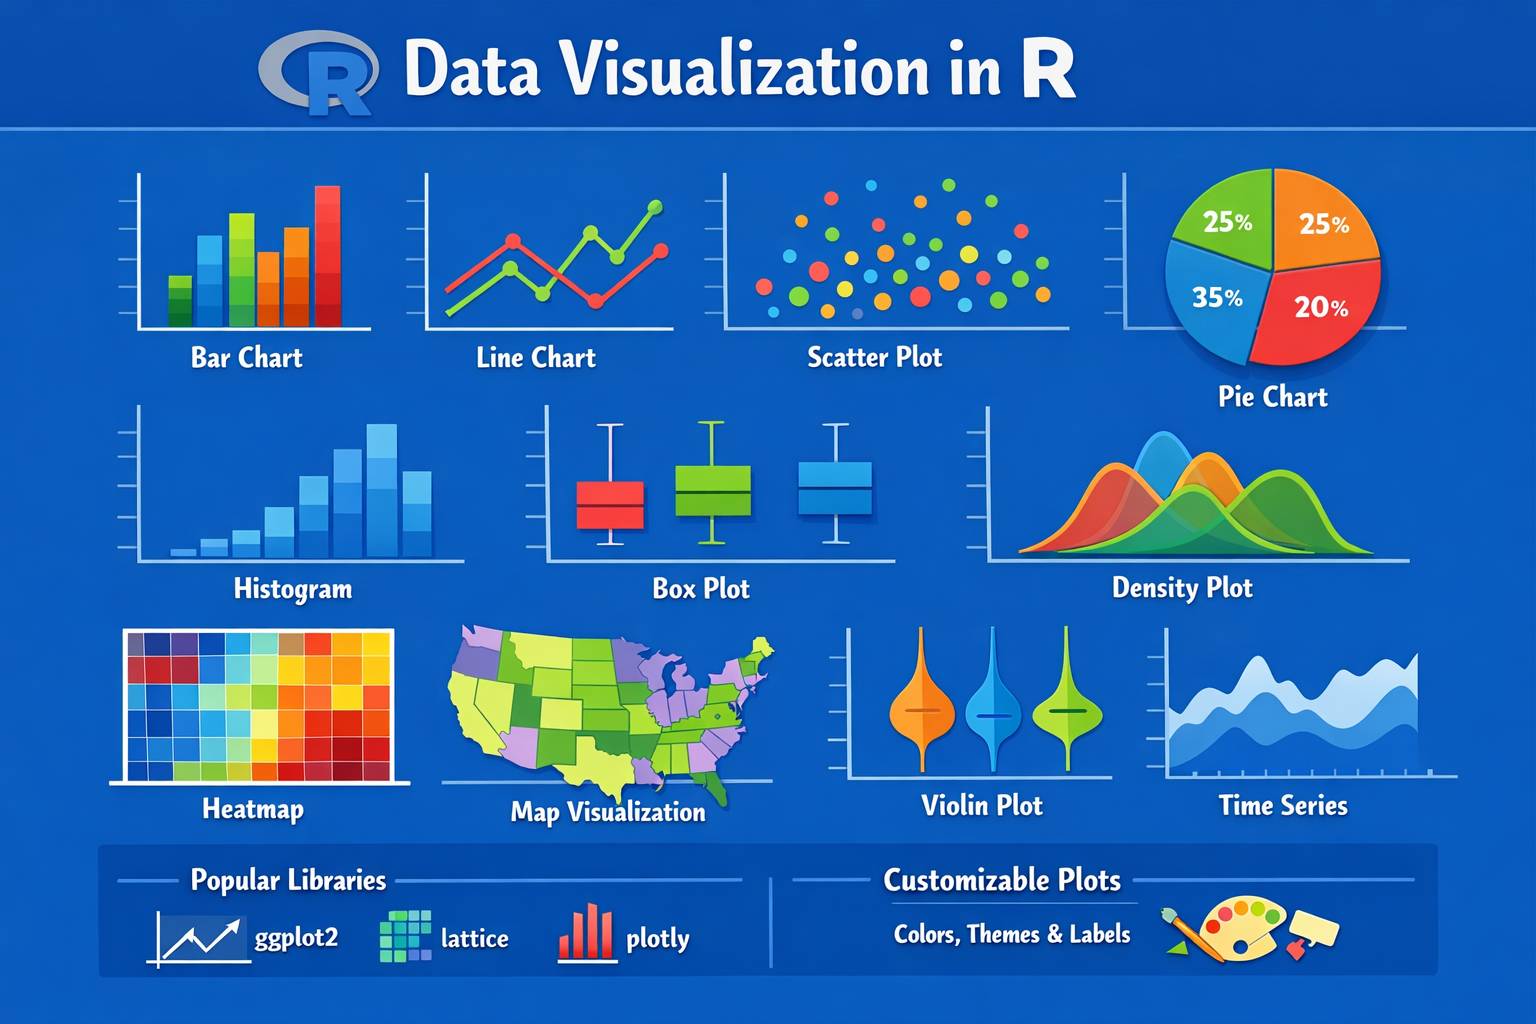
Mastering Basic Data Visualization in R
An introductory tutorial on creating compelling charts and graphs using the R programming language.
Tools & Recommended Reading
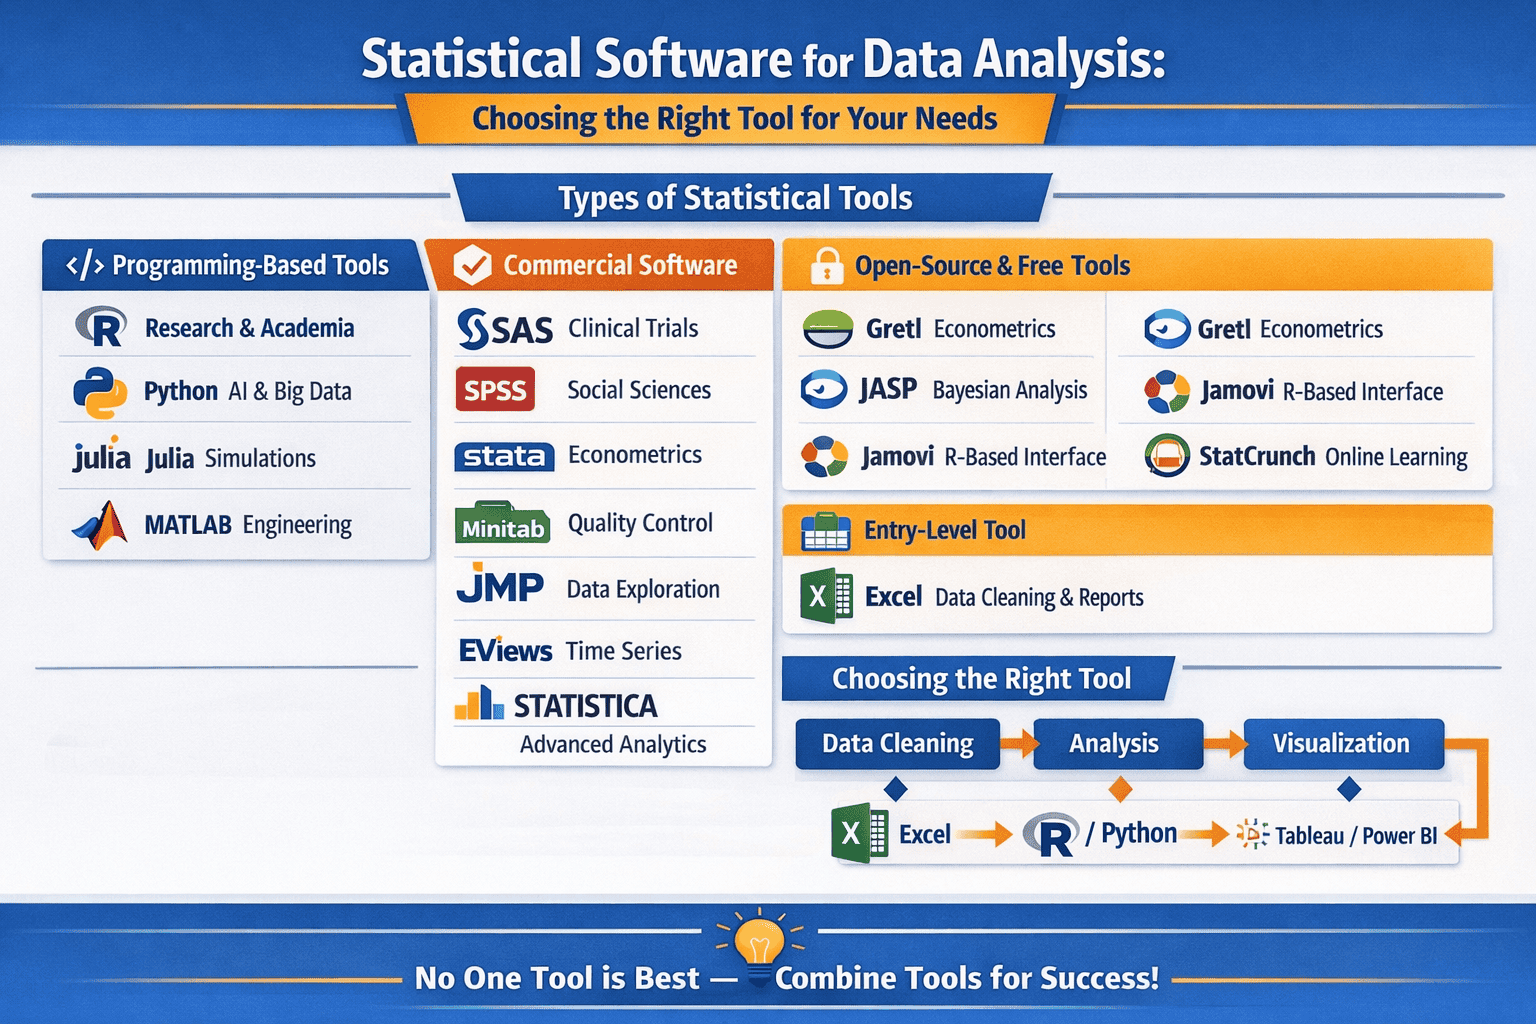
Essential Statistical Software for Researchers
A review of popular statistical packages like SPSS, R, Python, and STATA, and when to use each.
Need personalized guidance?
If you can't find what you're looking for, or need direct expert assistance with your project, don't hesitate to reach out!
Contact Our Experts Today